Context growth
Context growth is the Blueprint-style deep view for how a session filled its window: one point per prompt (or every turn), Y = context tokens, overlays for cache, % marks, reasoning, and tool errors.
Open it from a session row / detail (growth), search hits, Agents, or the floating transcript chrome. Route: /growth/:provider/:id. Data: GET /api/sessions/:provider/growth/:id.
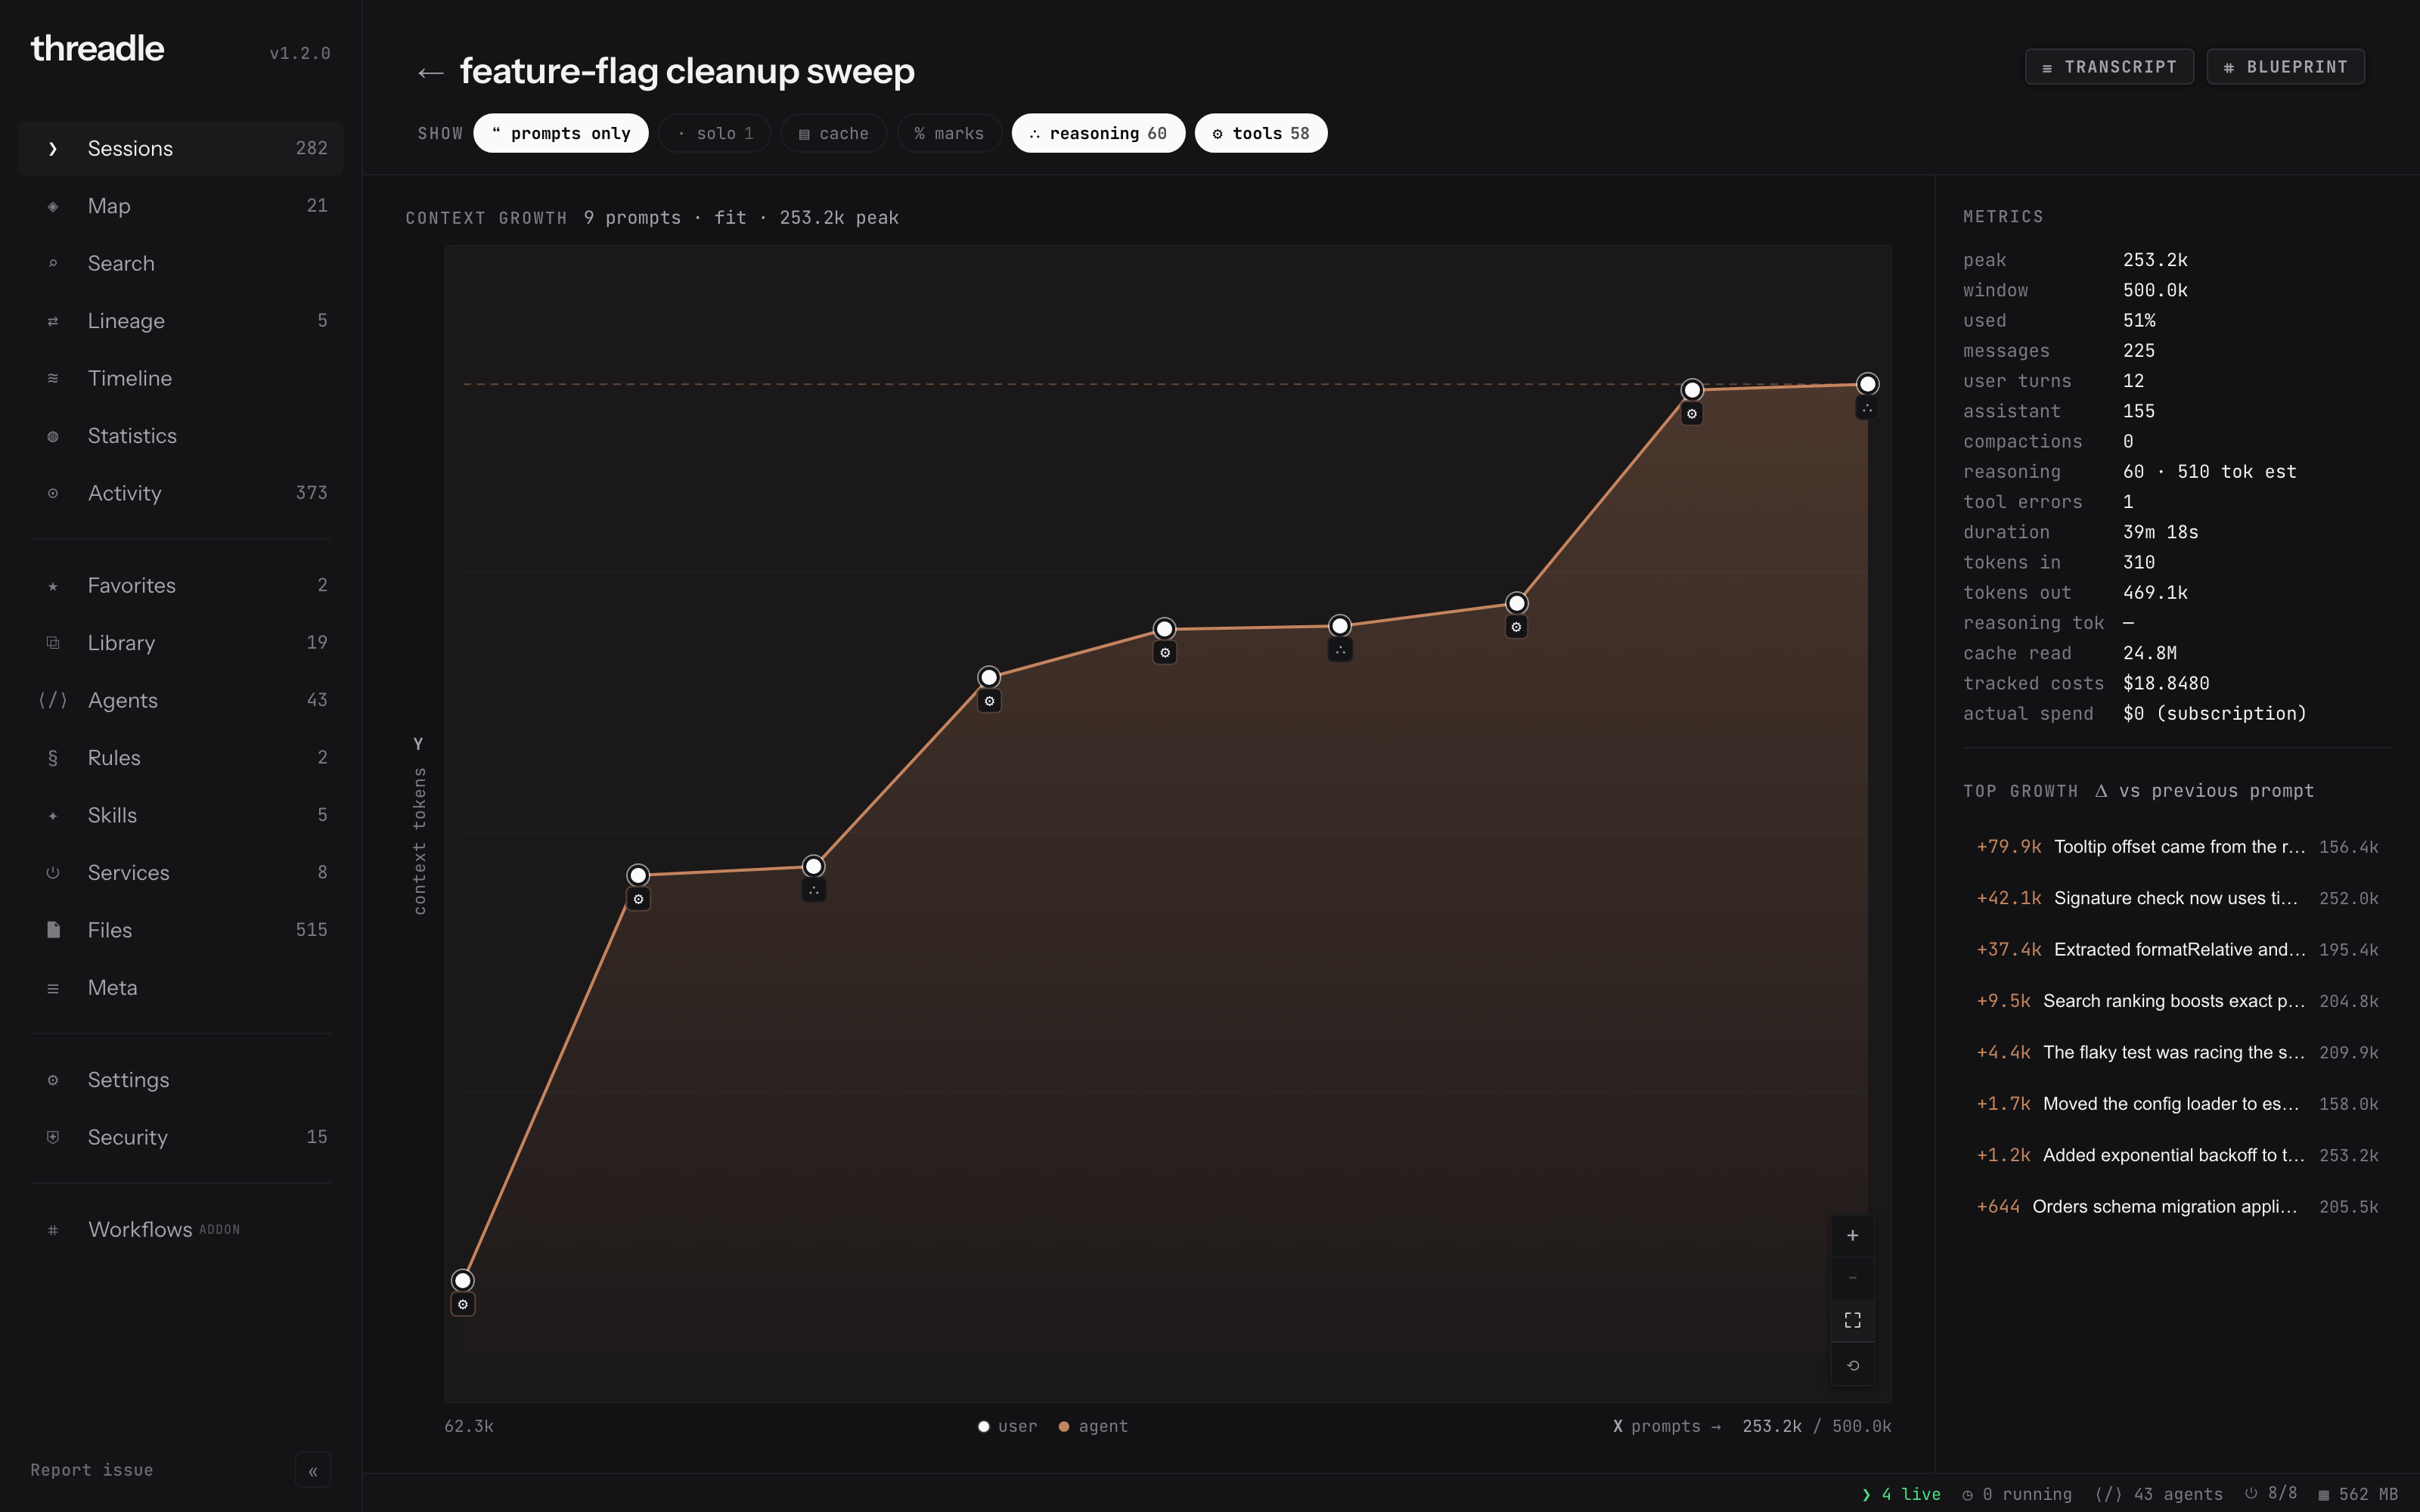
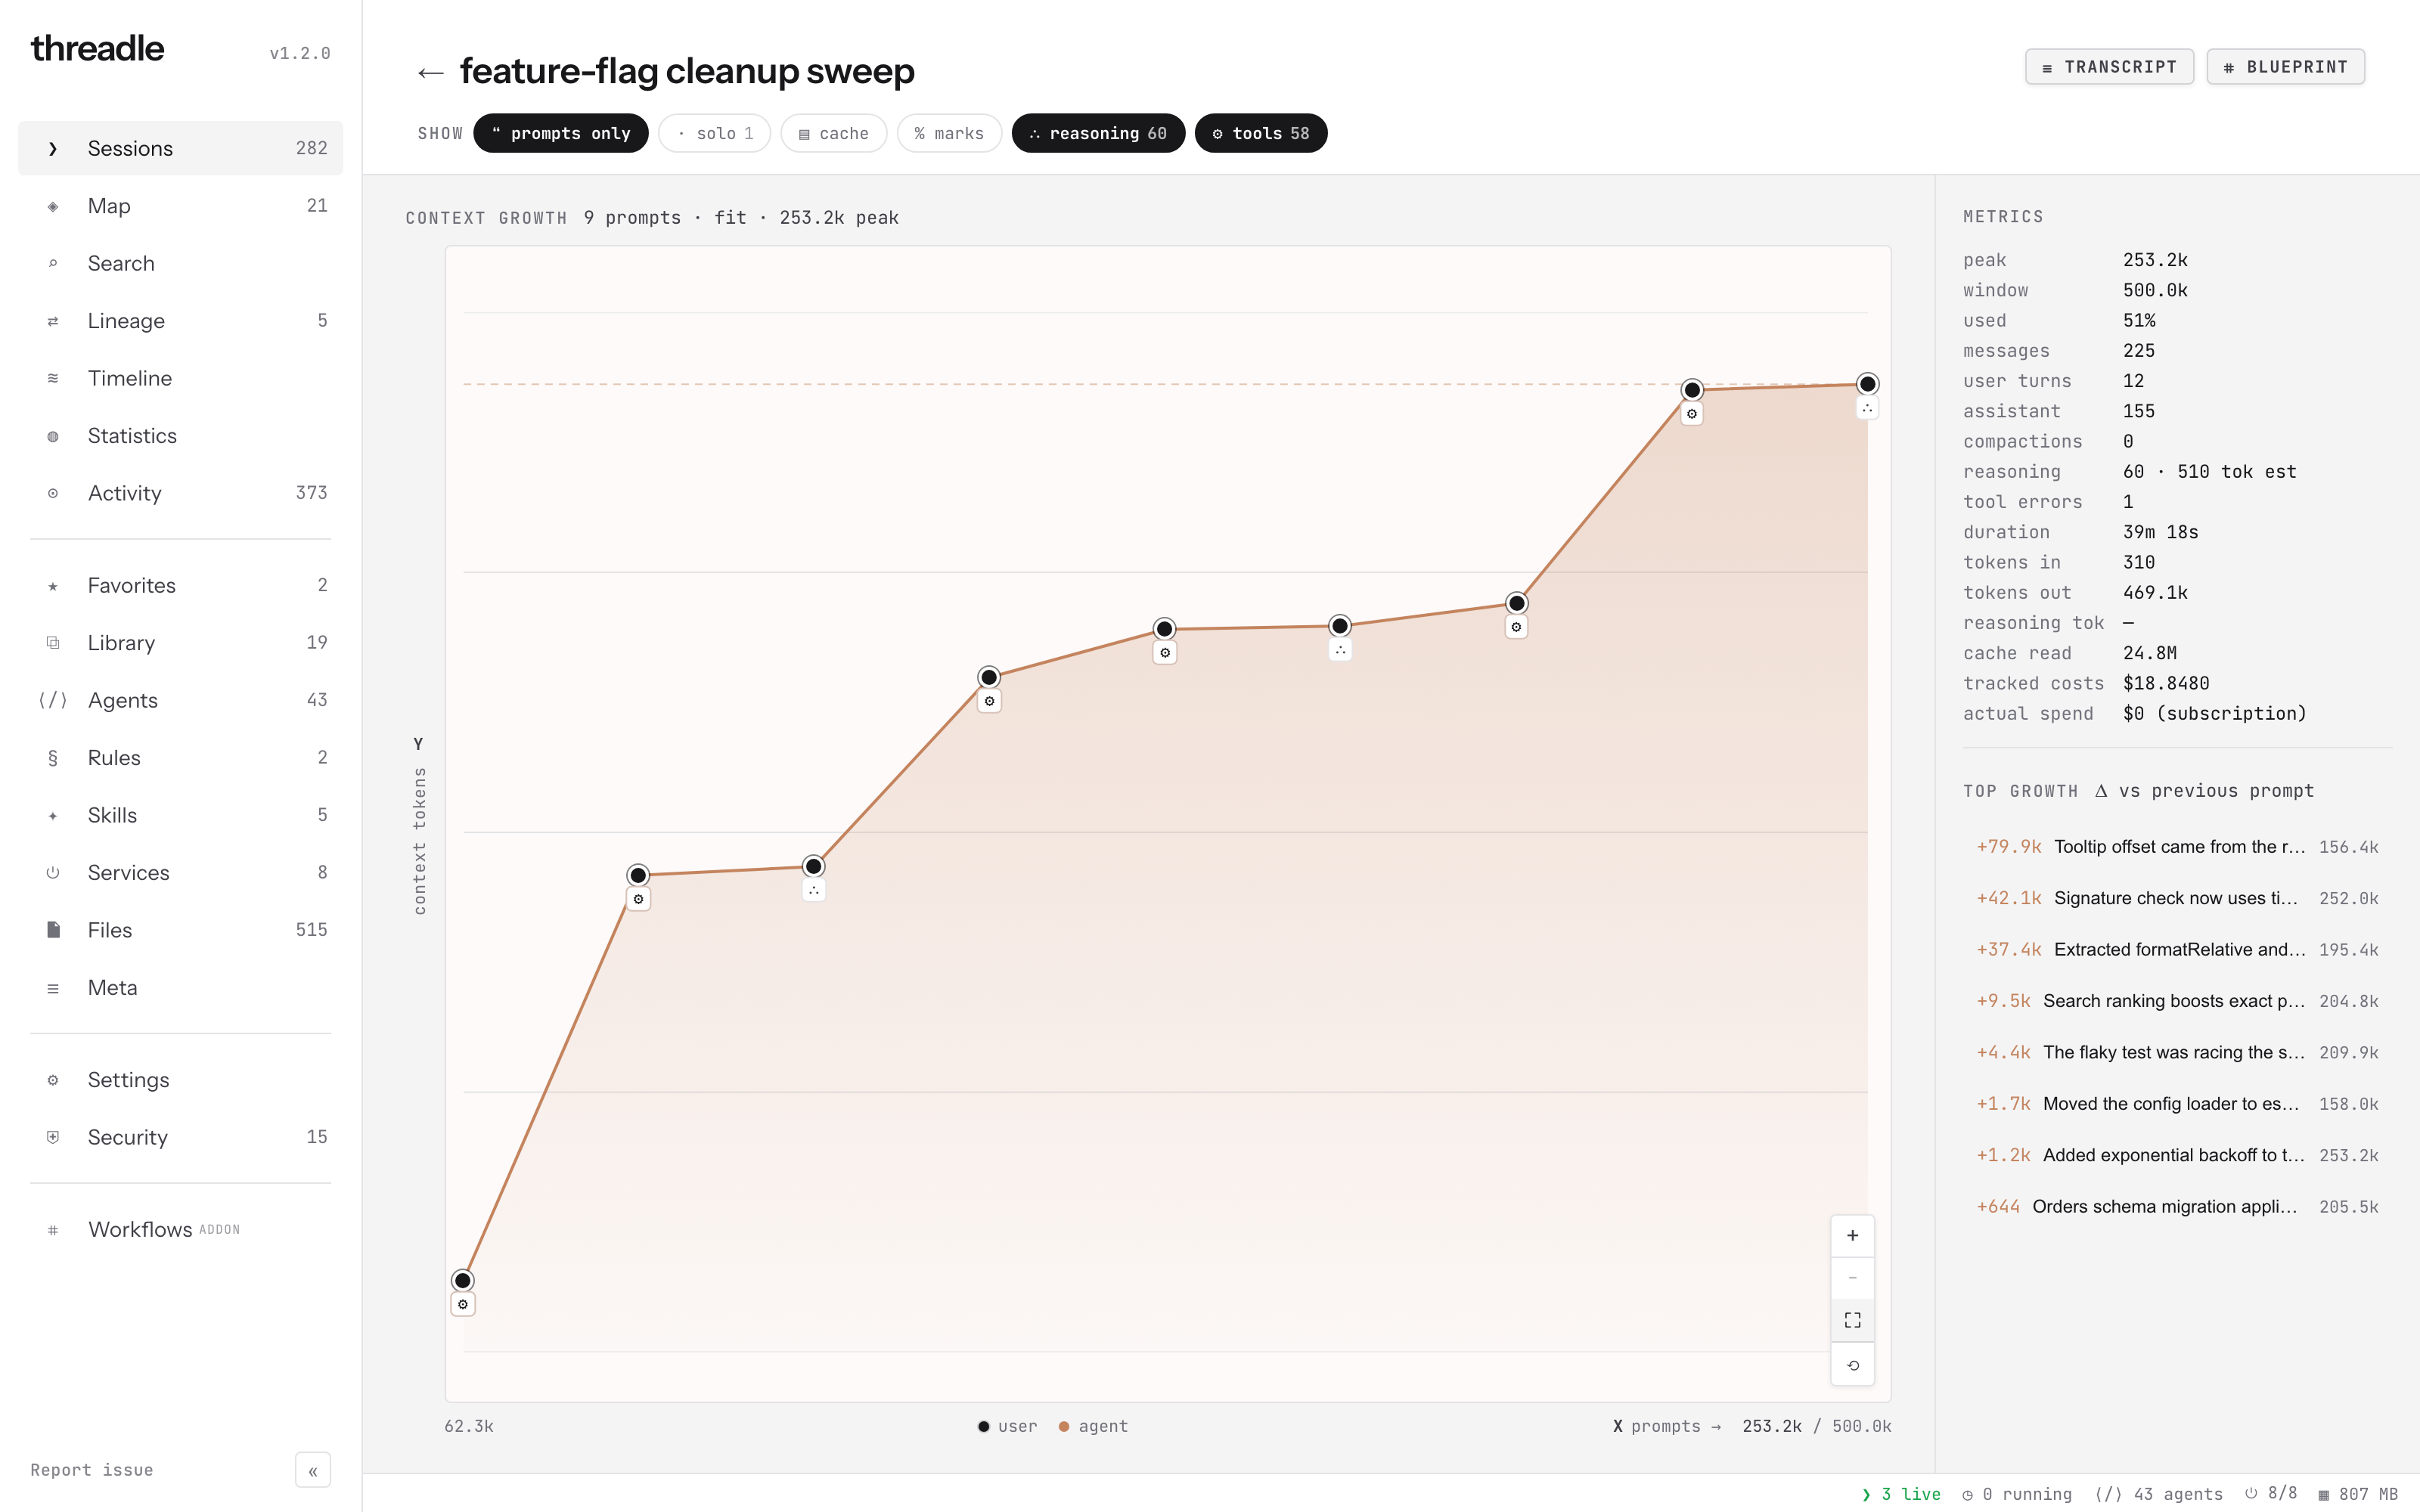
Fit Y scales the line to the visible range so a flat early stretch doesn’t crush the climb. Top growth lists the largest Δ vs the previous prompt.
Layers
Section titled “Layers”| Chip | Shows |
|---|---|
| prompts | One point per user prompt (default). Off → every assistant turn |
| cache | Cache-read tokens as a second series (usage providers only) |
| % marks | Horizontal 50% / 80% / 90% of the model window |
| reasoning | ∴ marks on turns that recorded thinking blocks |
| errors | ! marks on turns with tool errors |
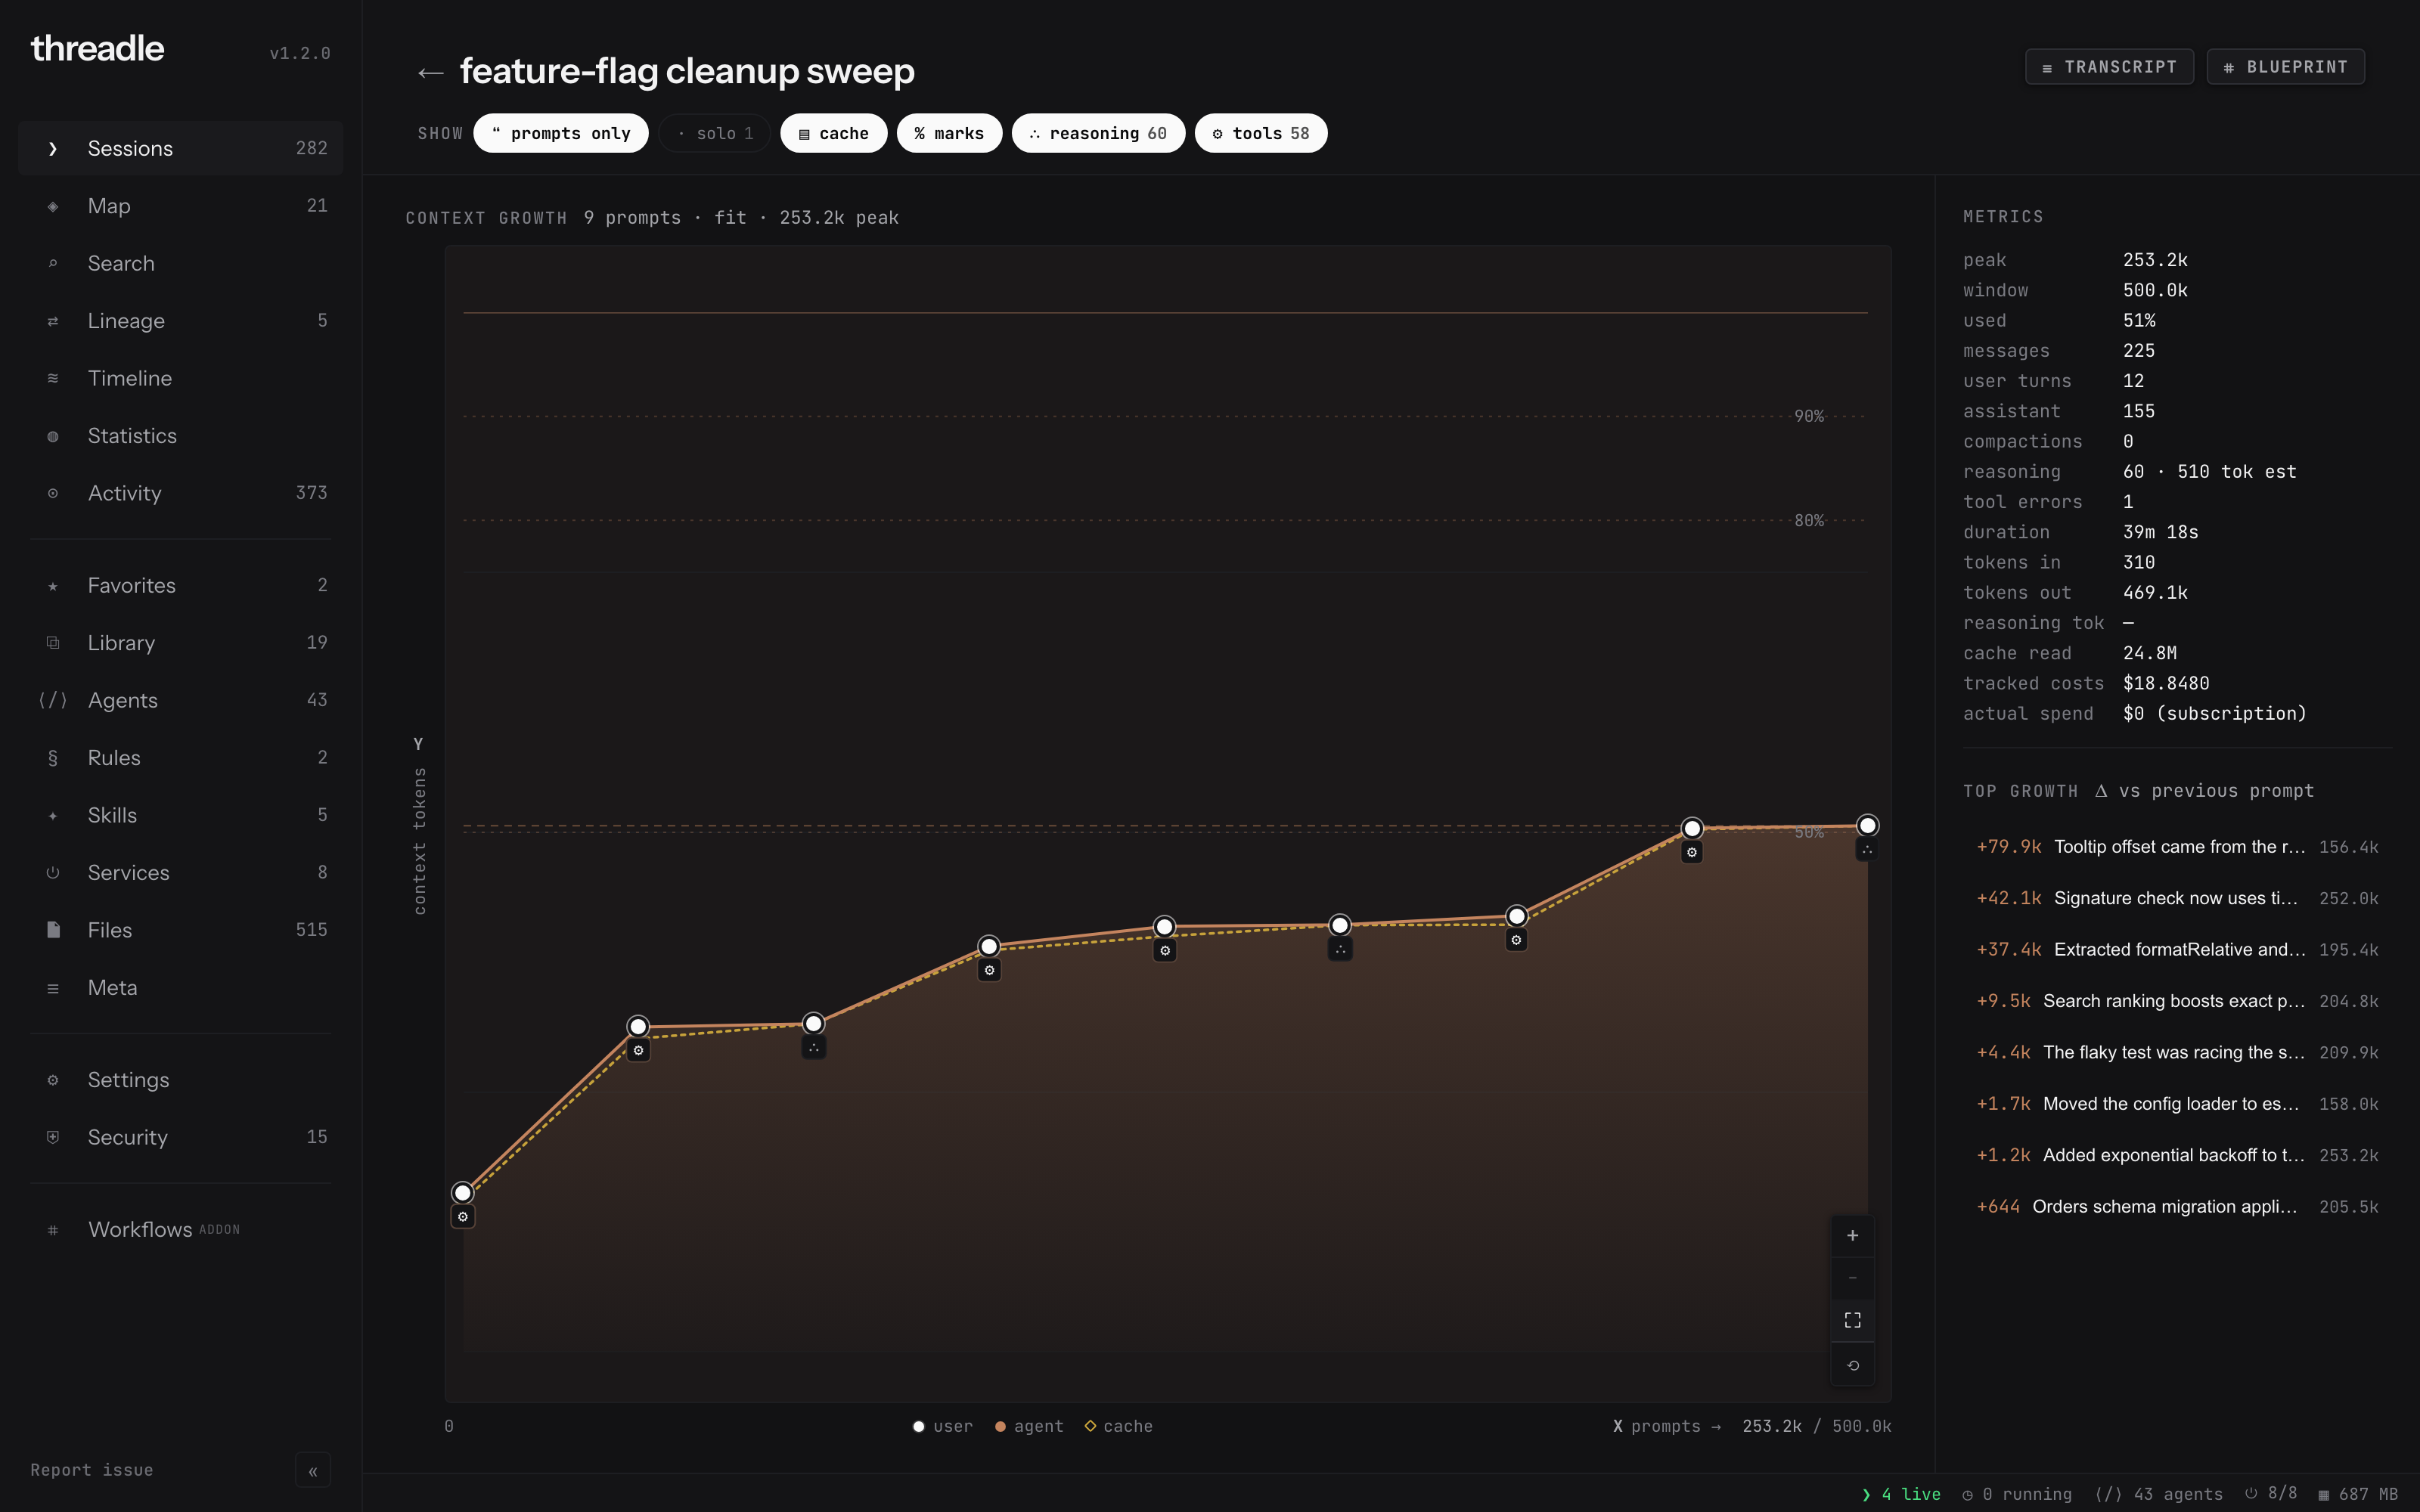
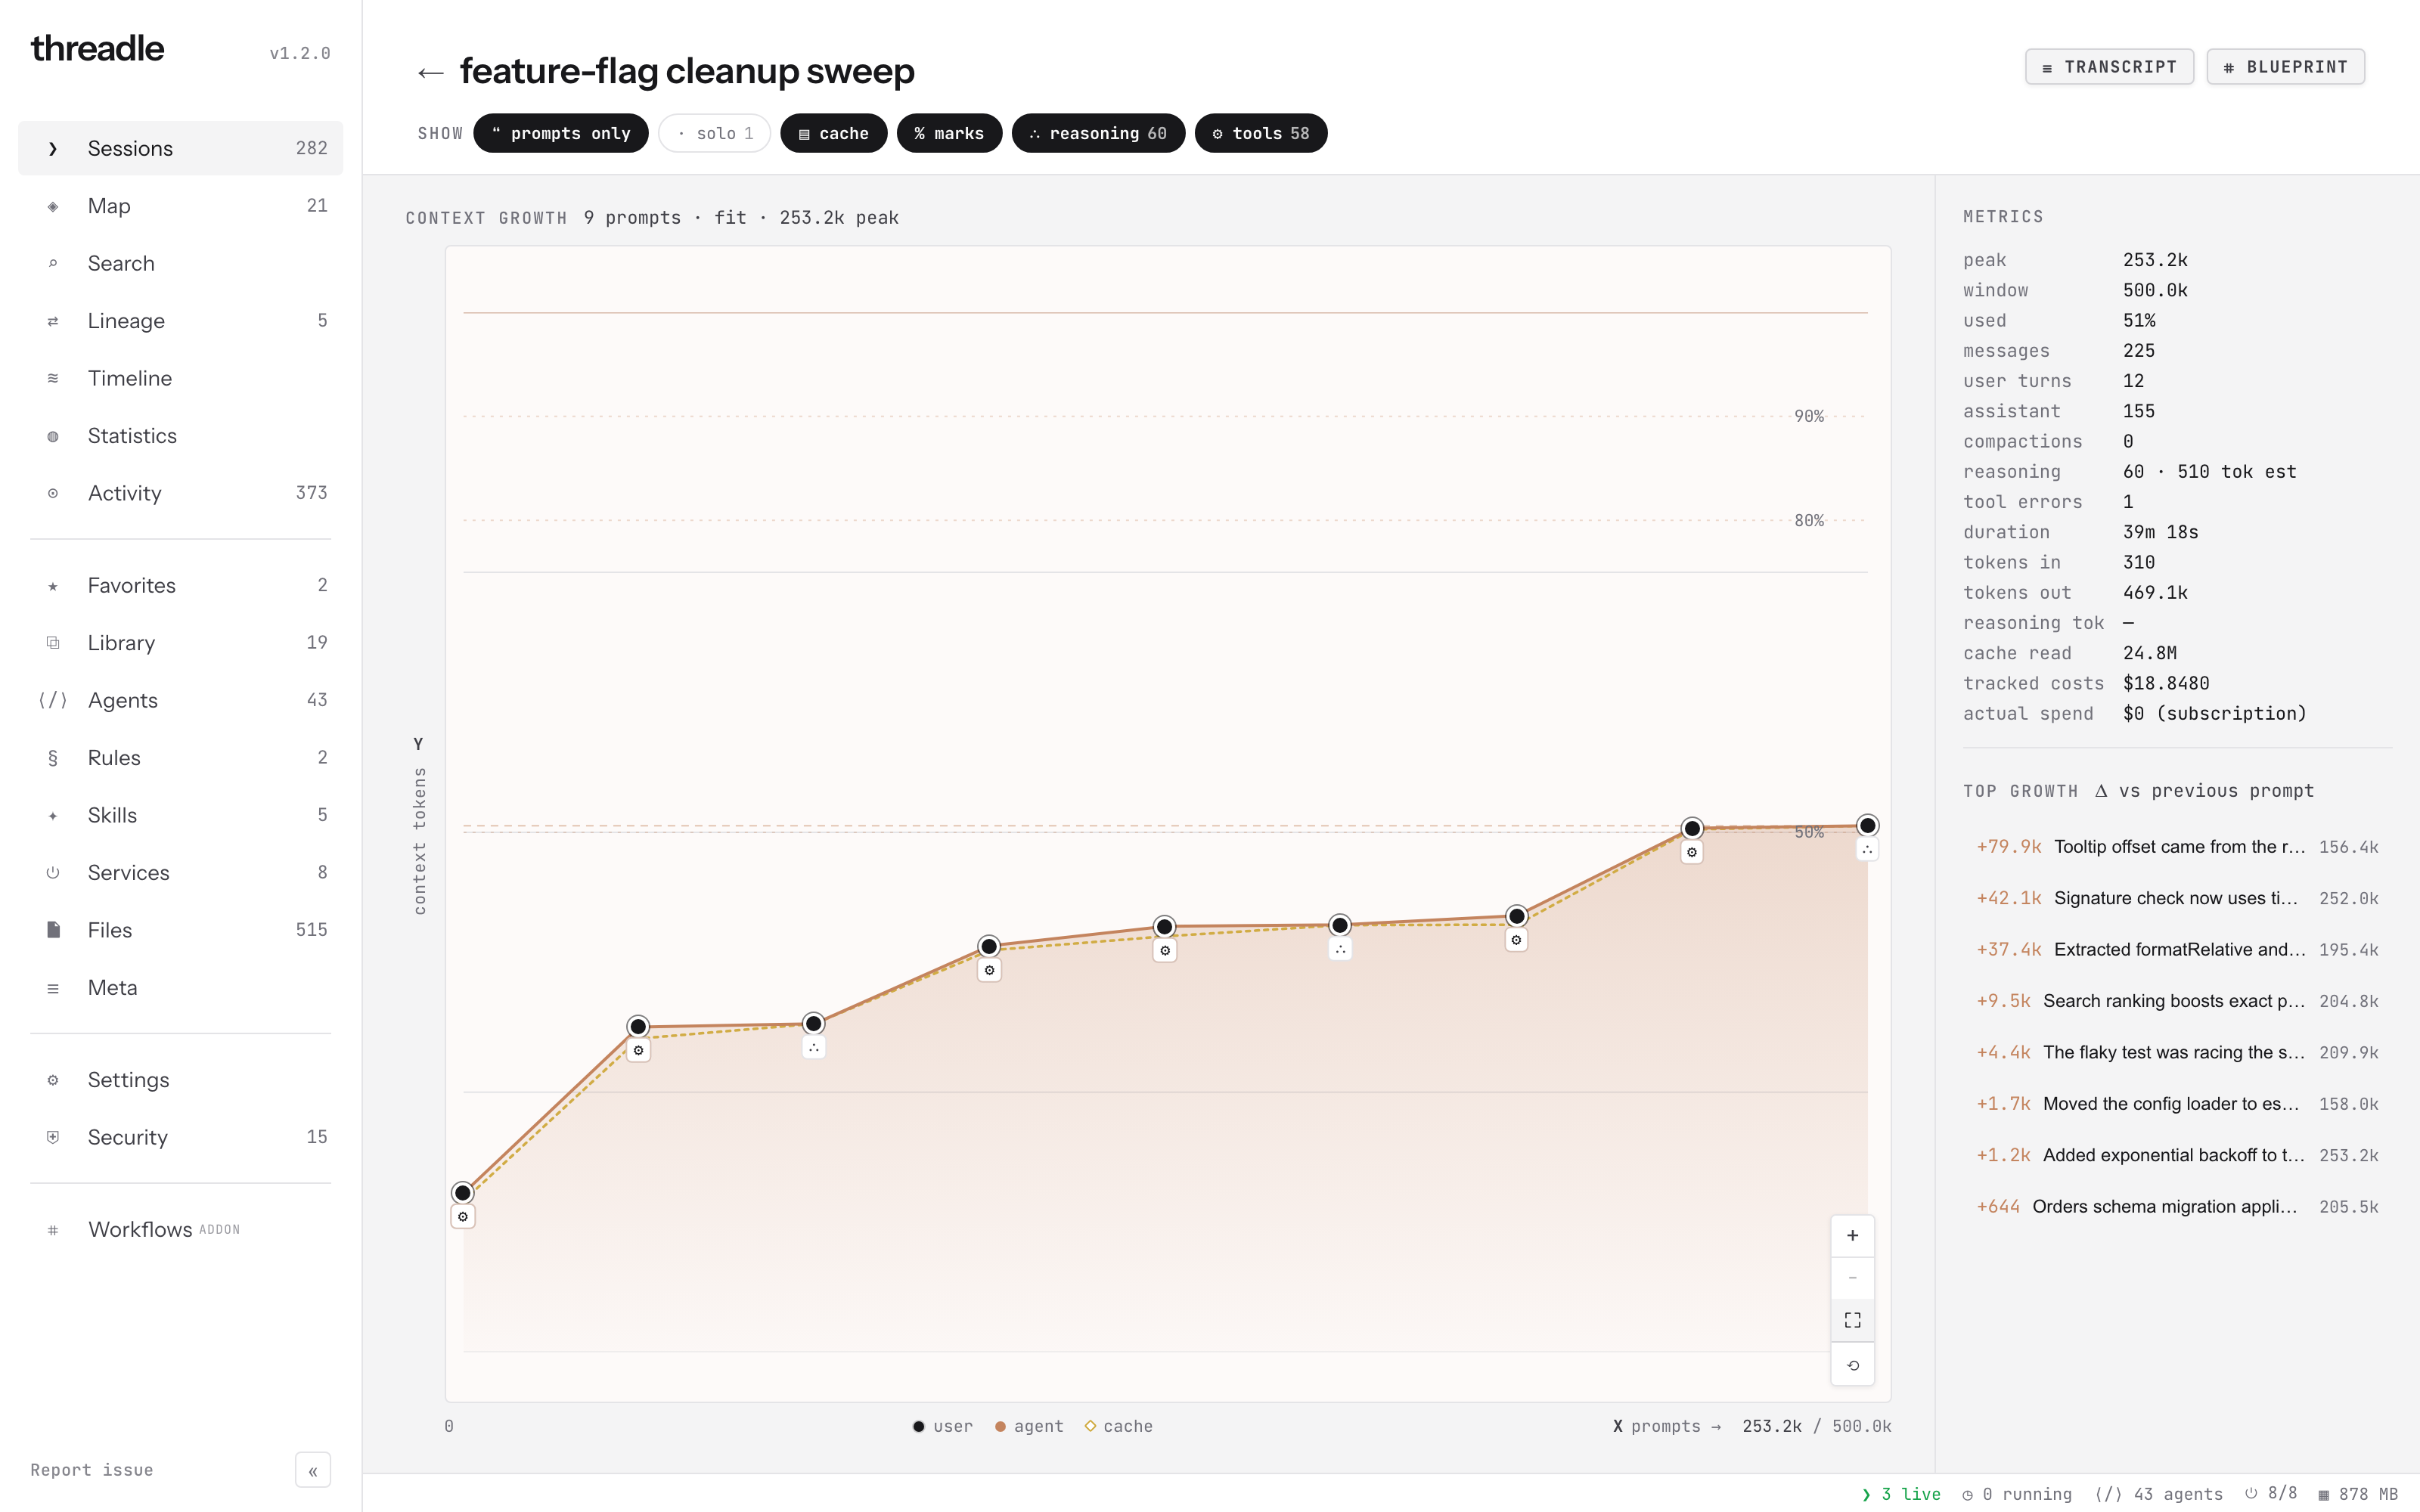
Cache dots + % marks on the same curve. Window line stays at the top when the peak is well below the limit.
Reading the chart
Section titled “Reading the chart”- Y is context tokens (usage when the provider records it; otherwise chars ÷ 4, captioned ~est).
- X is prompt (or turn) index. Compaction drops show as dashed ticks.
- Fit Y / Fit to screen (right-click) soft-scales to the visible line so the window ceiling doesn’t flatten the curve.
- Hover a point for delta, absolute size, cache hit, and the prompt preview. Click (or pick from top growth) to pin the side detail and jump the floating transcript to that message.
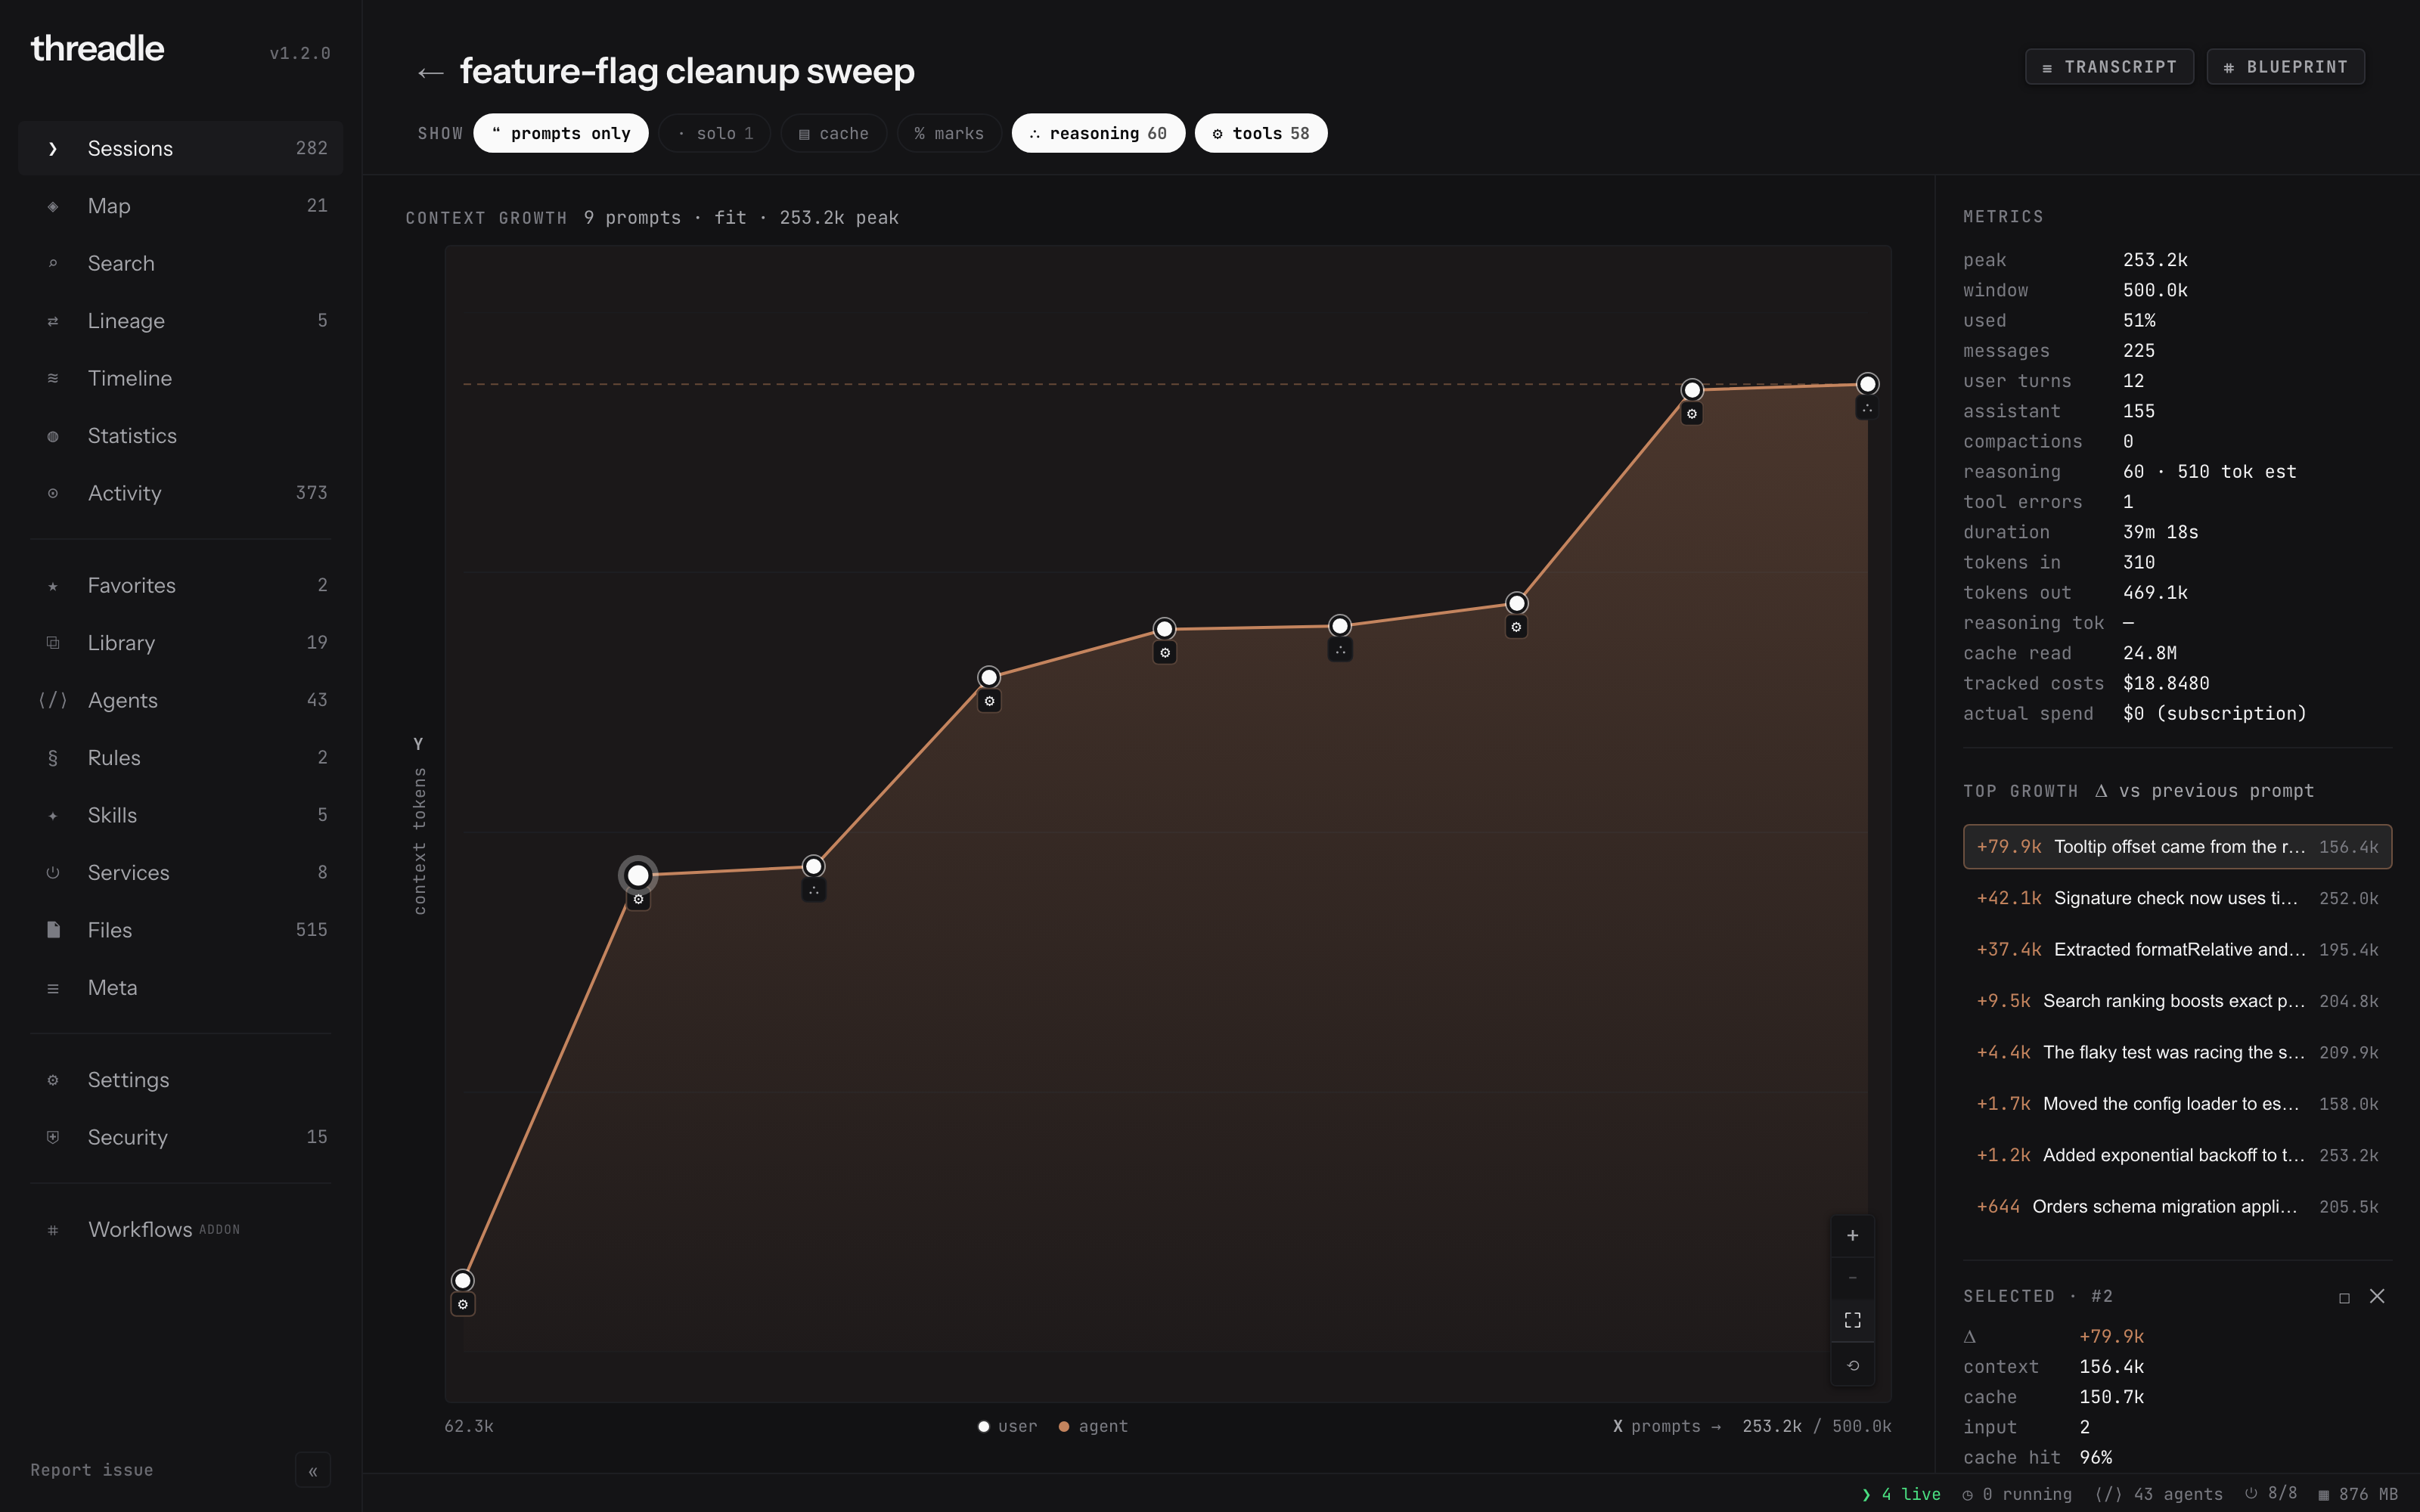
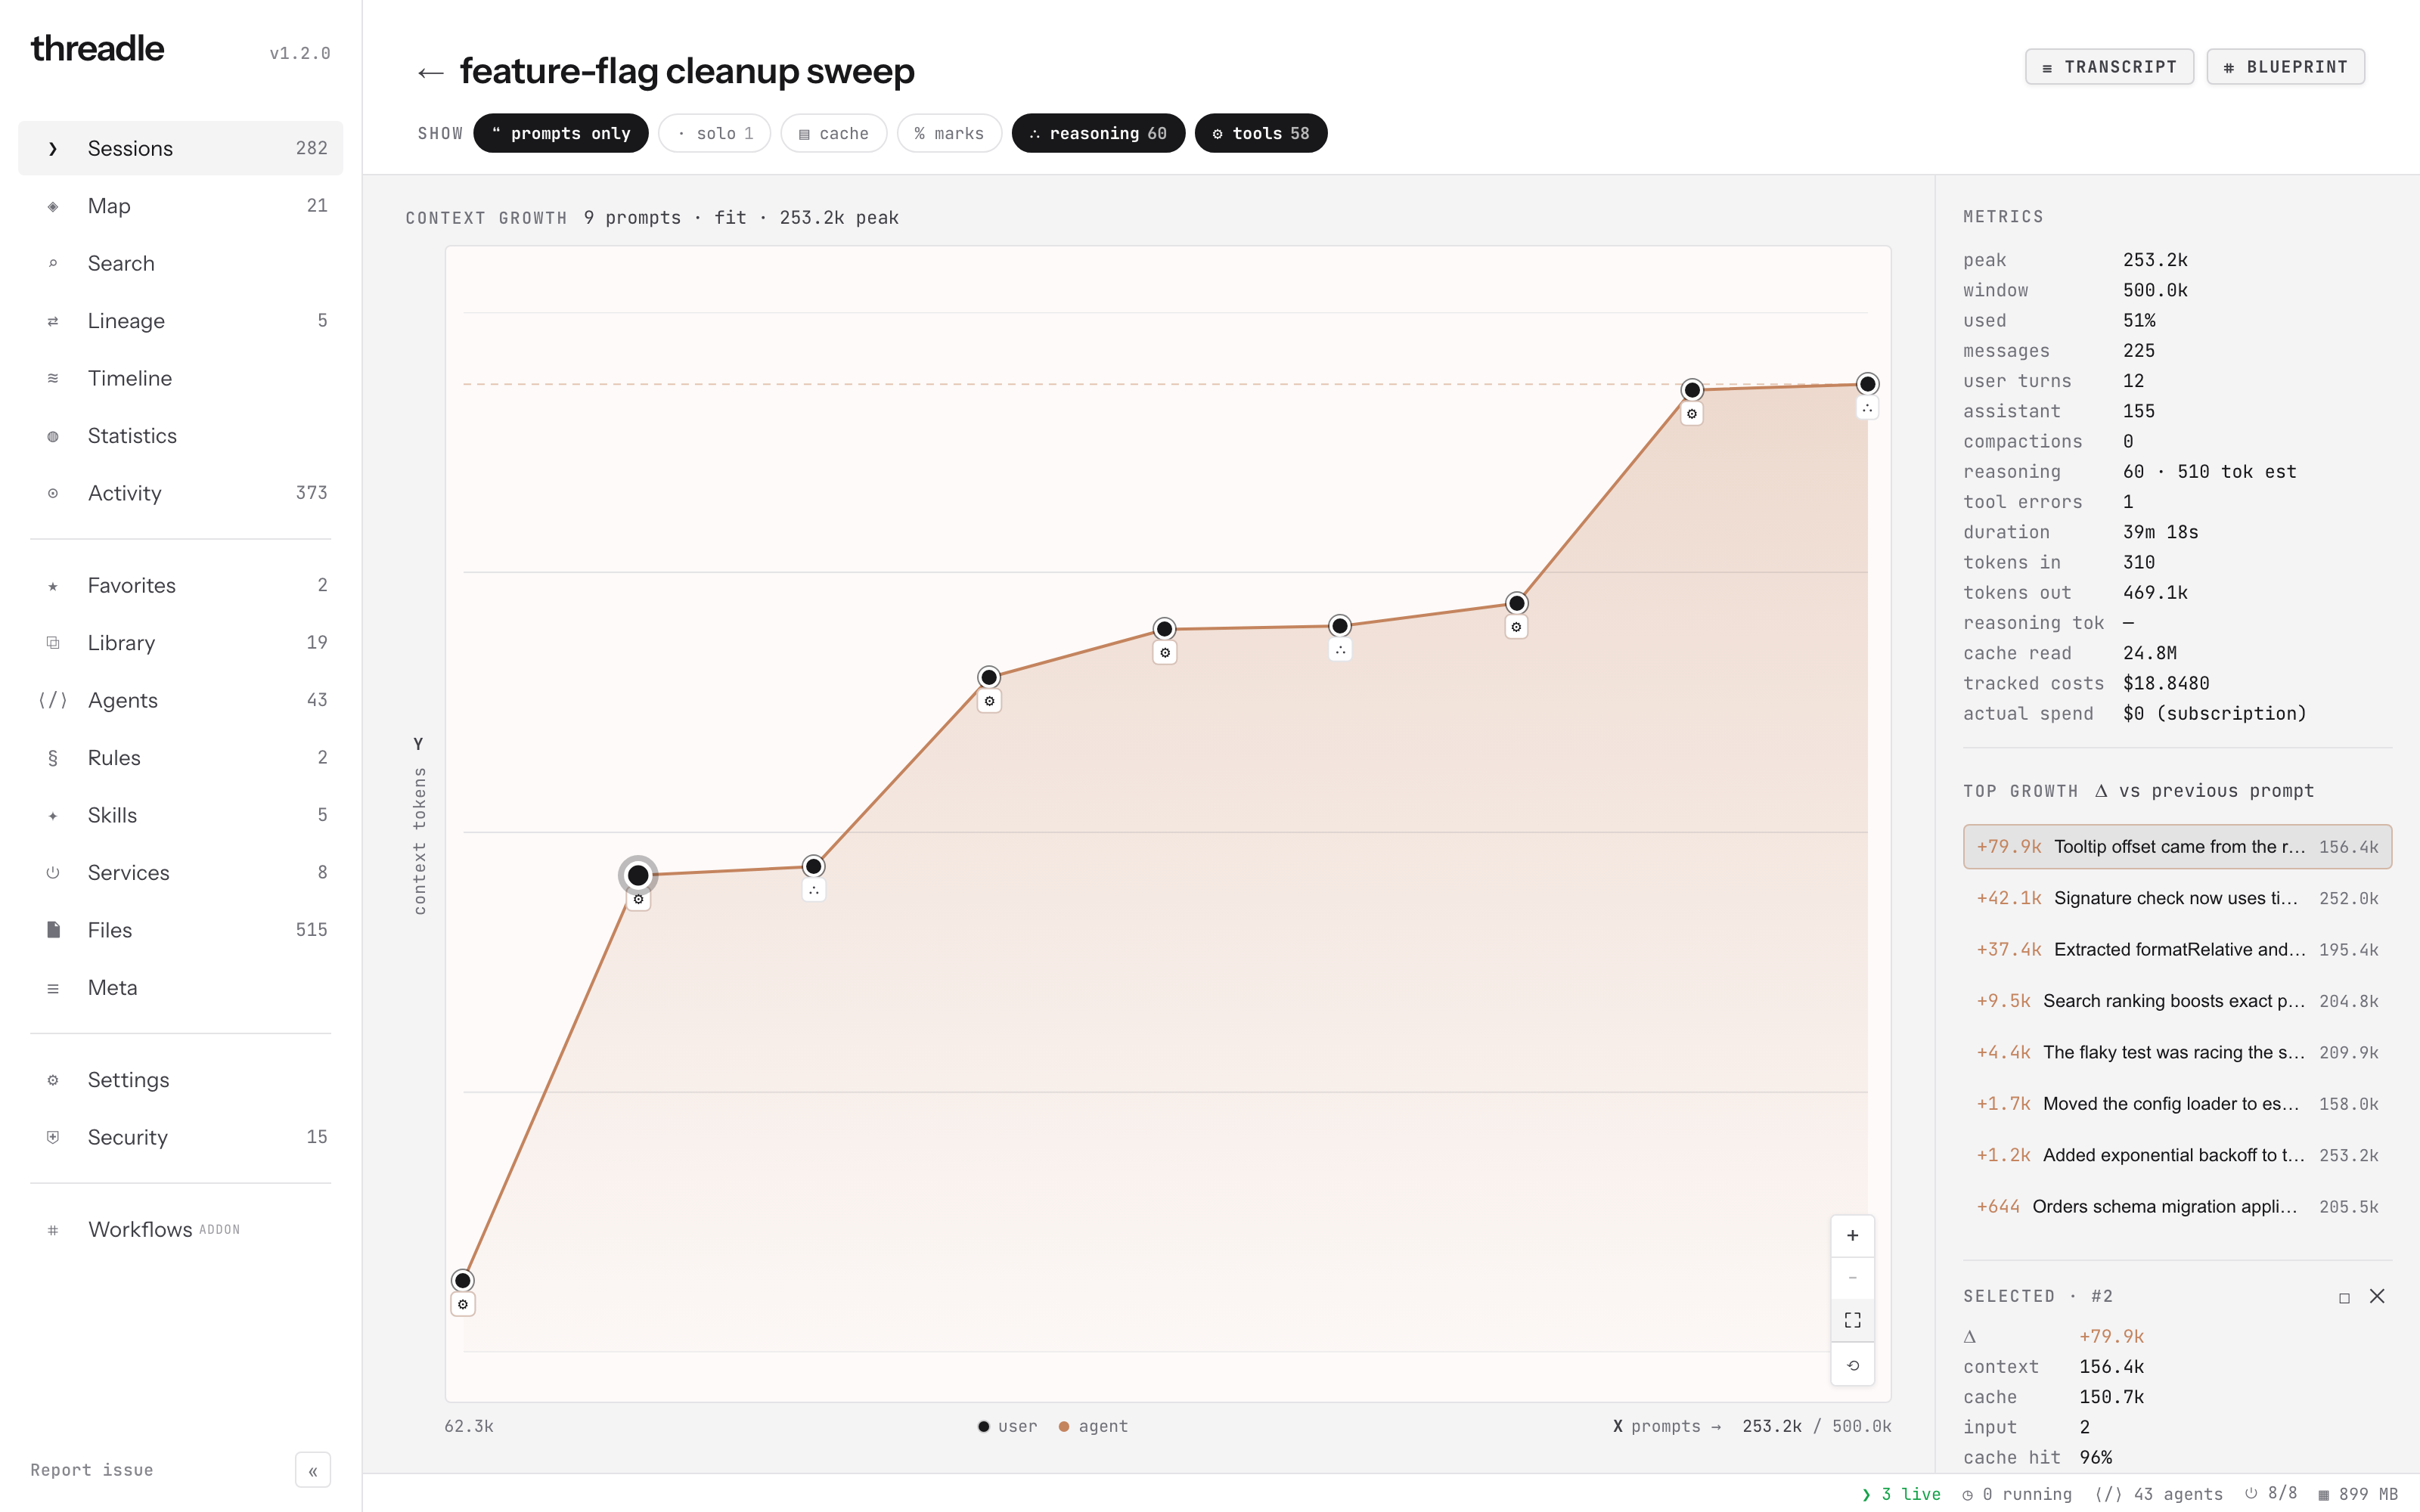
Selecting a top-growth row highlights the step and shows the prompt preview in the side panel.
Related
Section titled “Related”- Session blueprint. Graph of tools, files, and subagents for the same session
- Timeline, diff & stats. Cross-session views
- Costs & billing. Tracked costs vs actual spend