
Lineage
Lineage answers one question: where did this context come from, and where did it go? The view at /lineage draws a layered graph of sessions and payloads, wired by extract and inject edges — across providers.
❯ claude session ──extract──▸ ❝ distilled ──inject──▸ ❯ opencode sessionHow edges are recorded
Section titled “How edges are recorded”| Edge | Source of truth |
|---|---|
| session → payload (extract) | The payload’s own source field — always known, for every payload ever stored |
| payload → session (inject) | ~/.config/threadle/runs/injects.jsonl, one JSON object per line |
An inject record holds the timestamp, payload hash, mode, target, and the resulting session. It is appended by:
POST /api/inject— every injection through the inject modal or a canvas nodePOST /api/lineage/record— handoffs that bypass the inject route, notably the one-step ⇄ hand off modal (mode: handoff) and the workflow runner feeding a payload into an agent as a prompt (mode: workflow)
Recording is best-effort and append-only: a failed write never fails the injection, and a corrupt line is skipped on read. Injections made before this file existed simply have no inject edge.
GET /api/lineage returns { payloads, injects, runSessions } — the last being sessions a threadle job produced, used to badge nodes as workflow.
Reading the canvas
Section titled “Reading the canvas”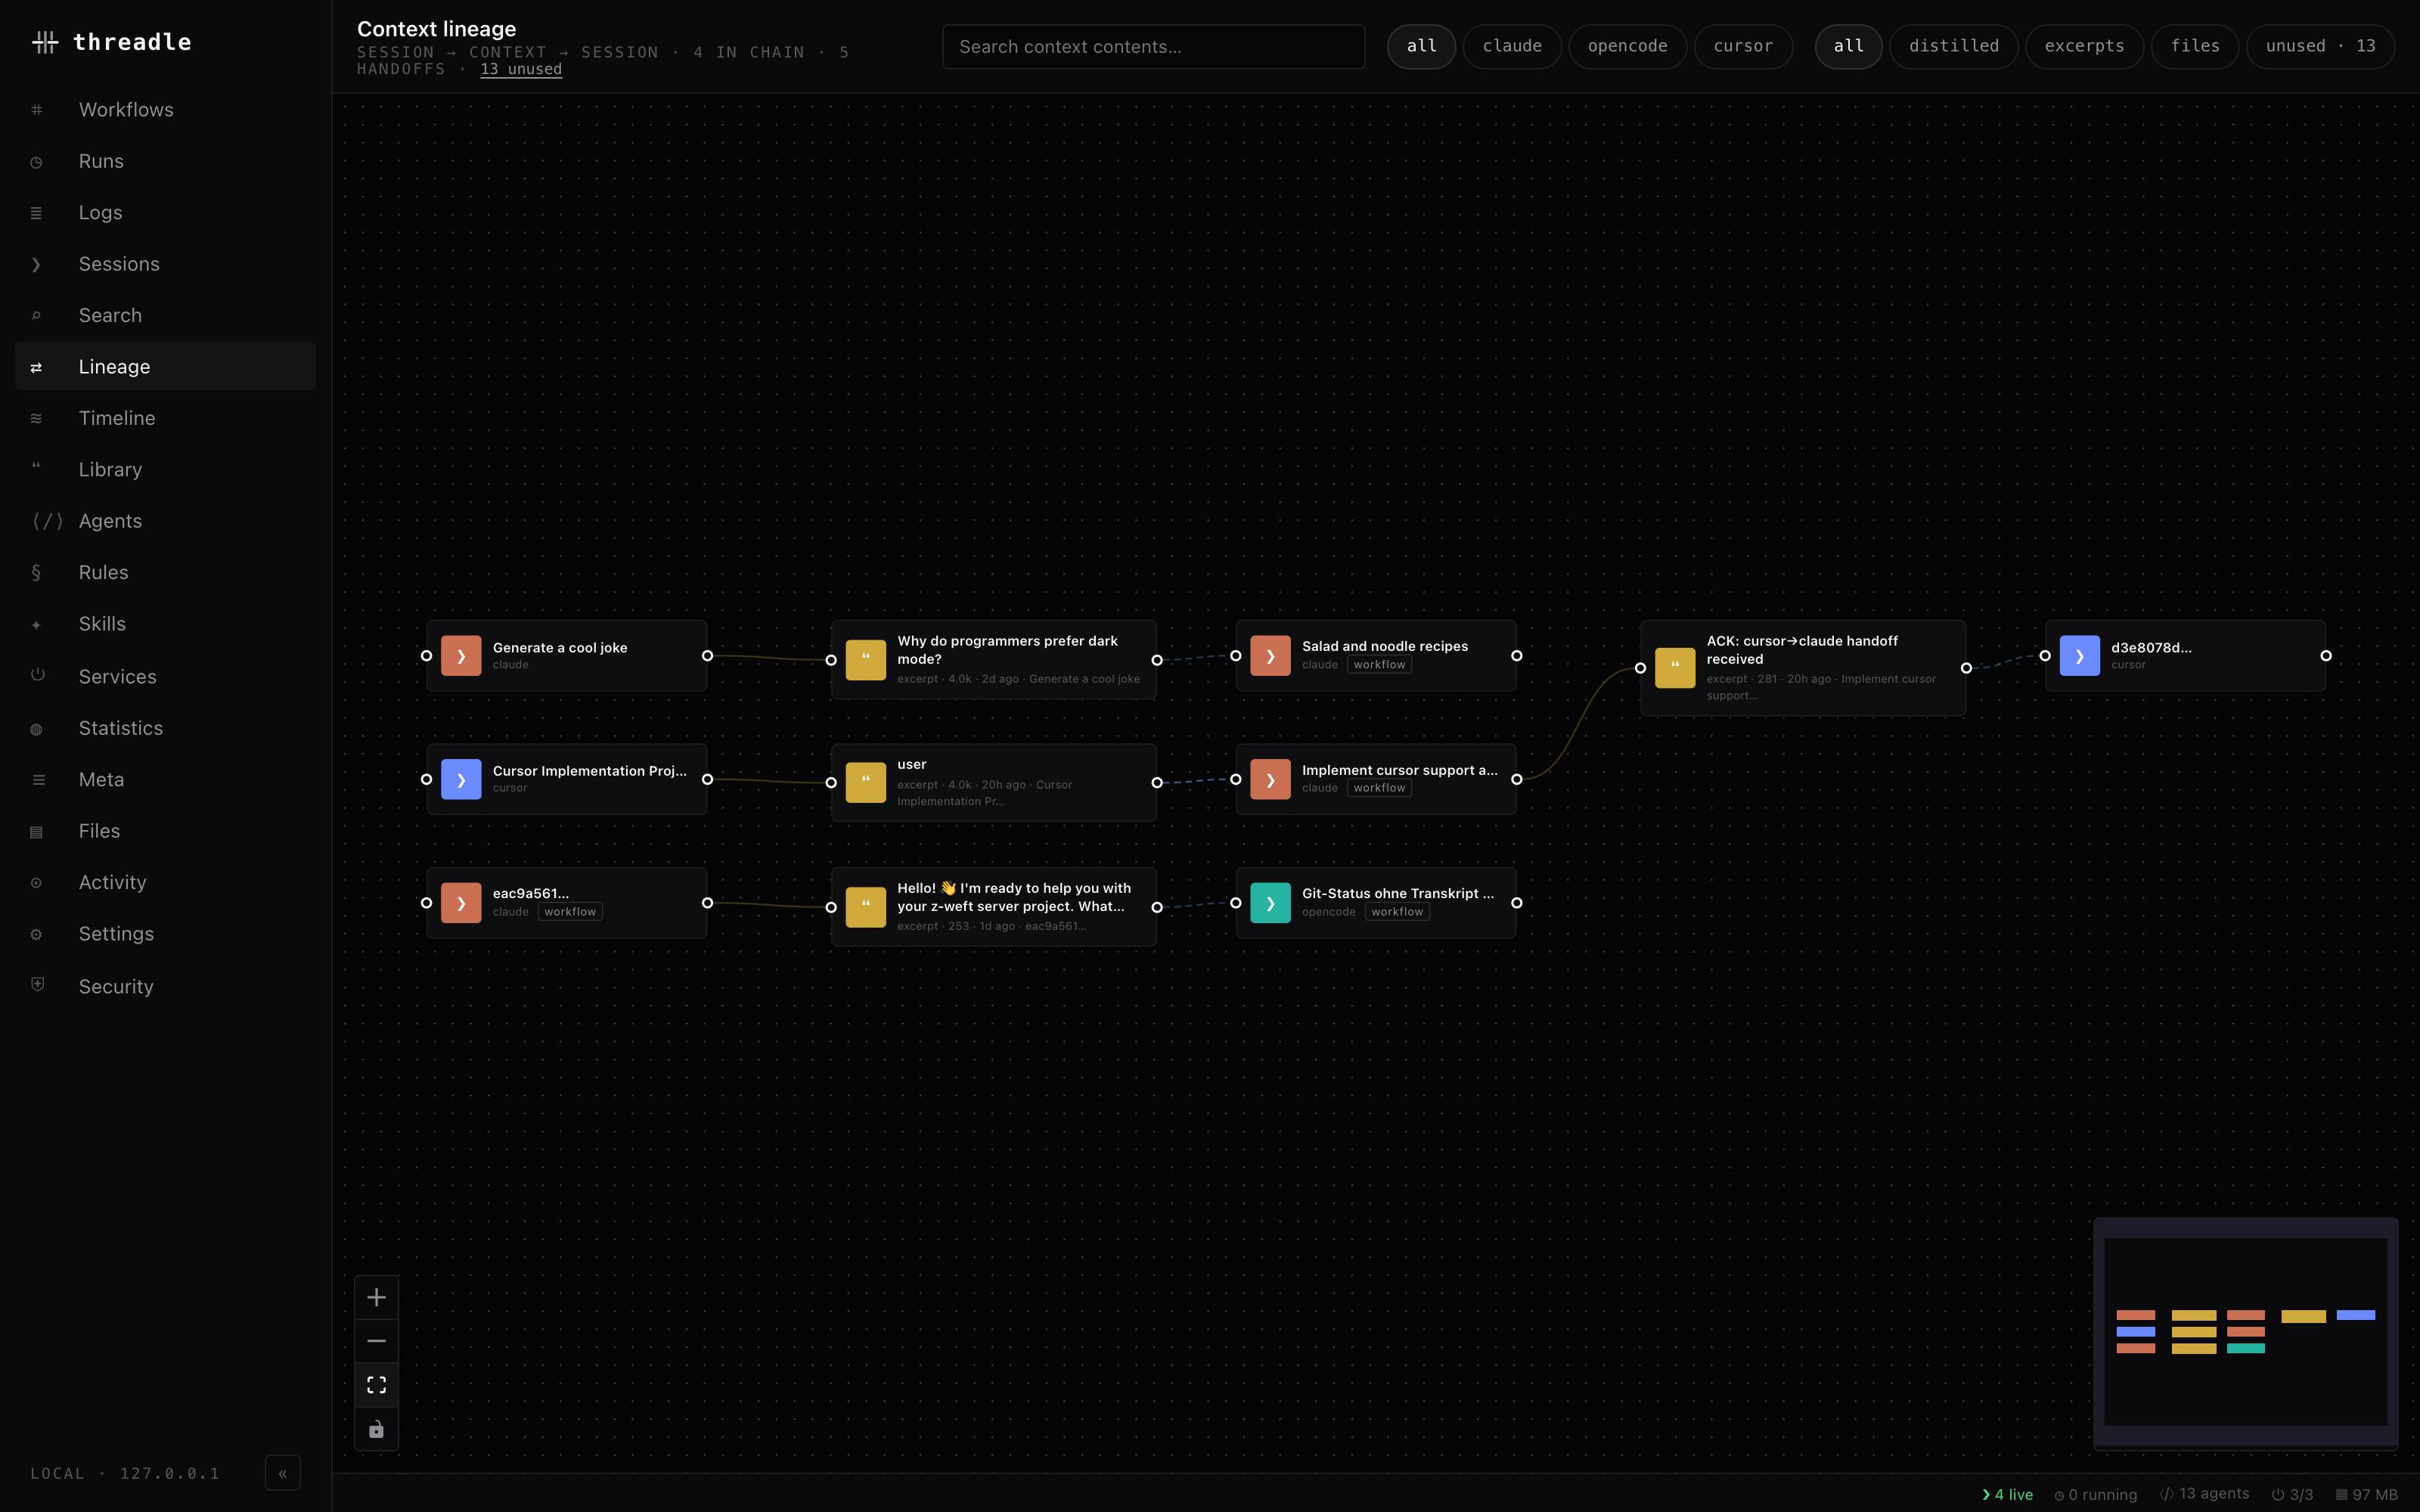
Sessions (❯) and payloads (❝) alternating left to right — one chain per thread of context.
Nodes are laid out by depth (x) with barycentre ordering inside each layer (y), so chains read left to right and crossings stay low.
| Node | Glyph | Shows |
|---|---|---|
| session | ❯ | Title (live, from discovery) and provider, plus a workflow badge when a run touched it |
| payload | ❝ | Preview, kind, size, age, and short source |
Selecting a node highlights its connected component and dims everything else; edge labels (extract · 12.4k, fork · 12.4k) appear only on the highlighted thread, keeping the default canvas quiet. Arriving with ?focus=<provider>:<sessionId> locks that thread so a pane click does not clear it — that is what ⇄ lineage buttons elsewhere in the app pass.
Filters
Section titled “Filters”| Control | Values |
|---|---|
| Kind chips | all · distilled · excerpts · files |
| Provider chips | all · claude · opencode · cursor — matches the source or any inject target |
| unused | Payloads that were never injected. Hidden by default |
| Search box | Full-text over payload contents |
The header counts payloads in chains, total handoffs, and unused payloads. Clicking the unused count clears the kind and provider filters when nothing would otherwise appear — the promised count always becomes visible.
Search runs against the search index restricted to payloads (doctype=payload), debounced; matches are outlined and always shown, even if they are unused.
Click-through
Section titled “Click-through”Selecting a payload gives hash, kind, size, created, source, and a never injected status when it is an orphan — plus ⌗ blueprint of the source, ⇓ raw JSON, ⇆ diff against the injected result, a list of every injected into target, and the full content.
Selecting a session gives provider and id, ⌗ blueprint, ⇆ diff with its lineage peer, any threadle runs that touched it (click to open the workflow), and the full session info panel.
Elsewhere in the app
Section titled “Elsewhere in the app”- Session blueprints draw ❝ context nodes for payloads extracted from (↑) and injected into (↓) that session; the info panel’s
context handoffschips jump to lineage focused on it. - The library’s
⋯→ Lineage focuses the source session. - The Timeline detail aside has a ⇄ lineage button.
Related
Section titled “Related”- Cross-tool handoff — what creates these edges
- Context library — the payloads themselves
- Session blueprint — per-session view of the same handoffs