
Timeline, diff & stats
Three read-only views answer three different questions: when did this happen, why did A work and B not, and what is all of this costing.
Timeline
Section titled “Timeline”/timeline — every session on one clock, so parallel work and context switches are visible.
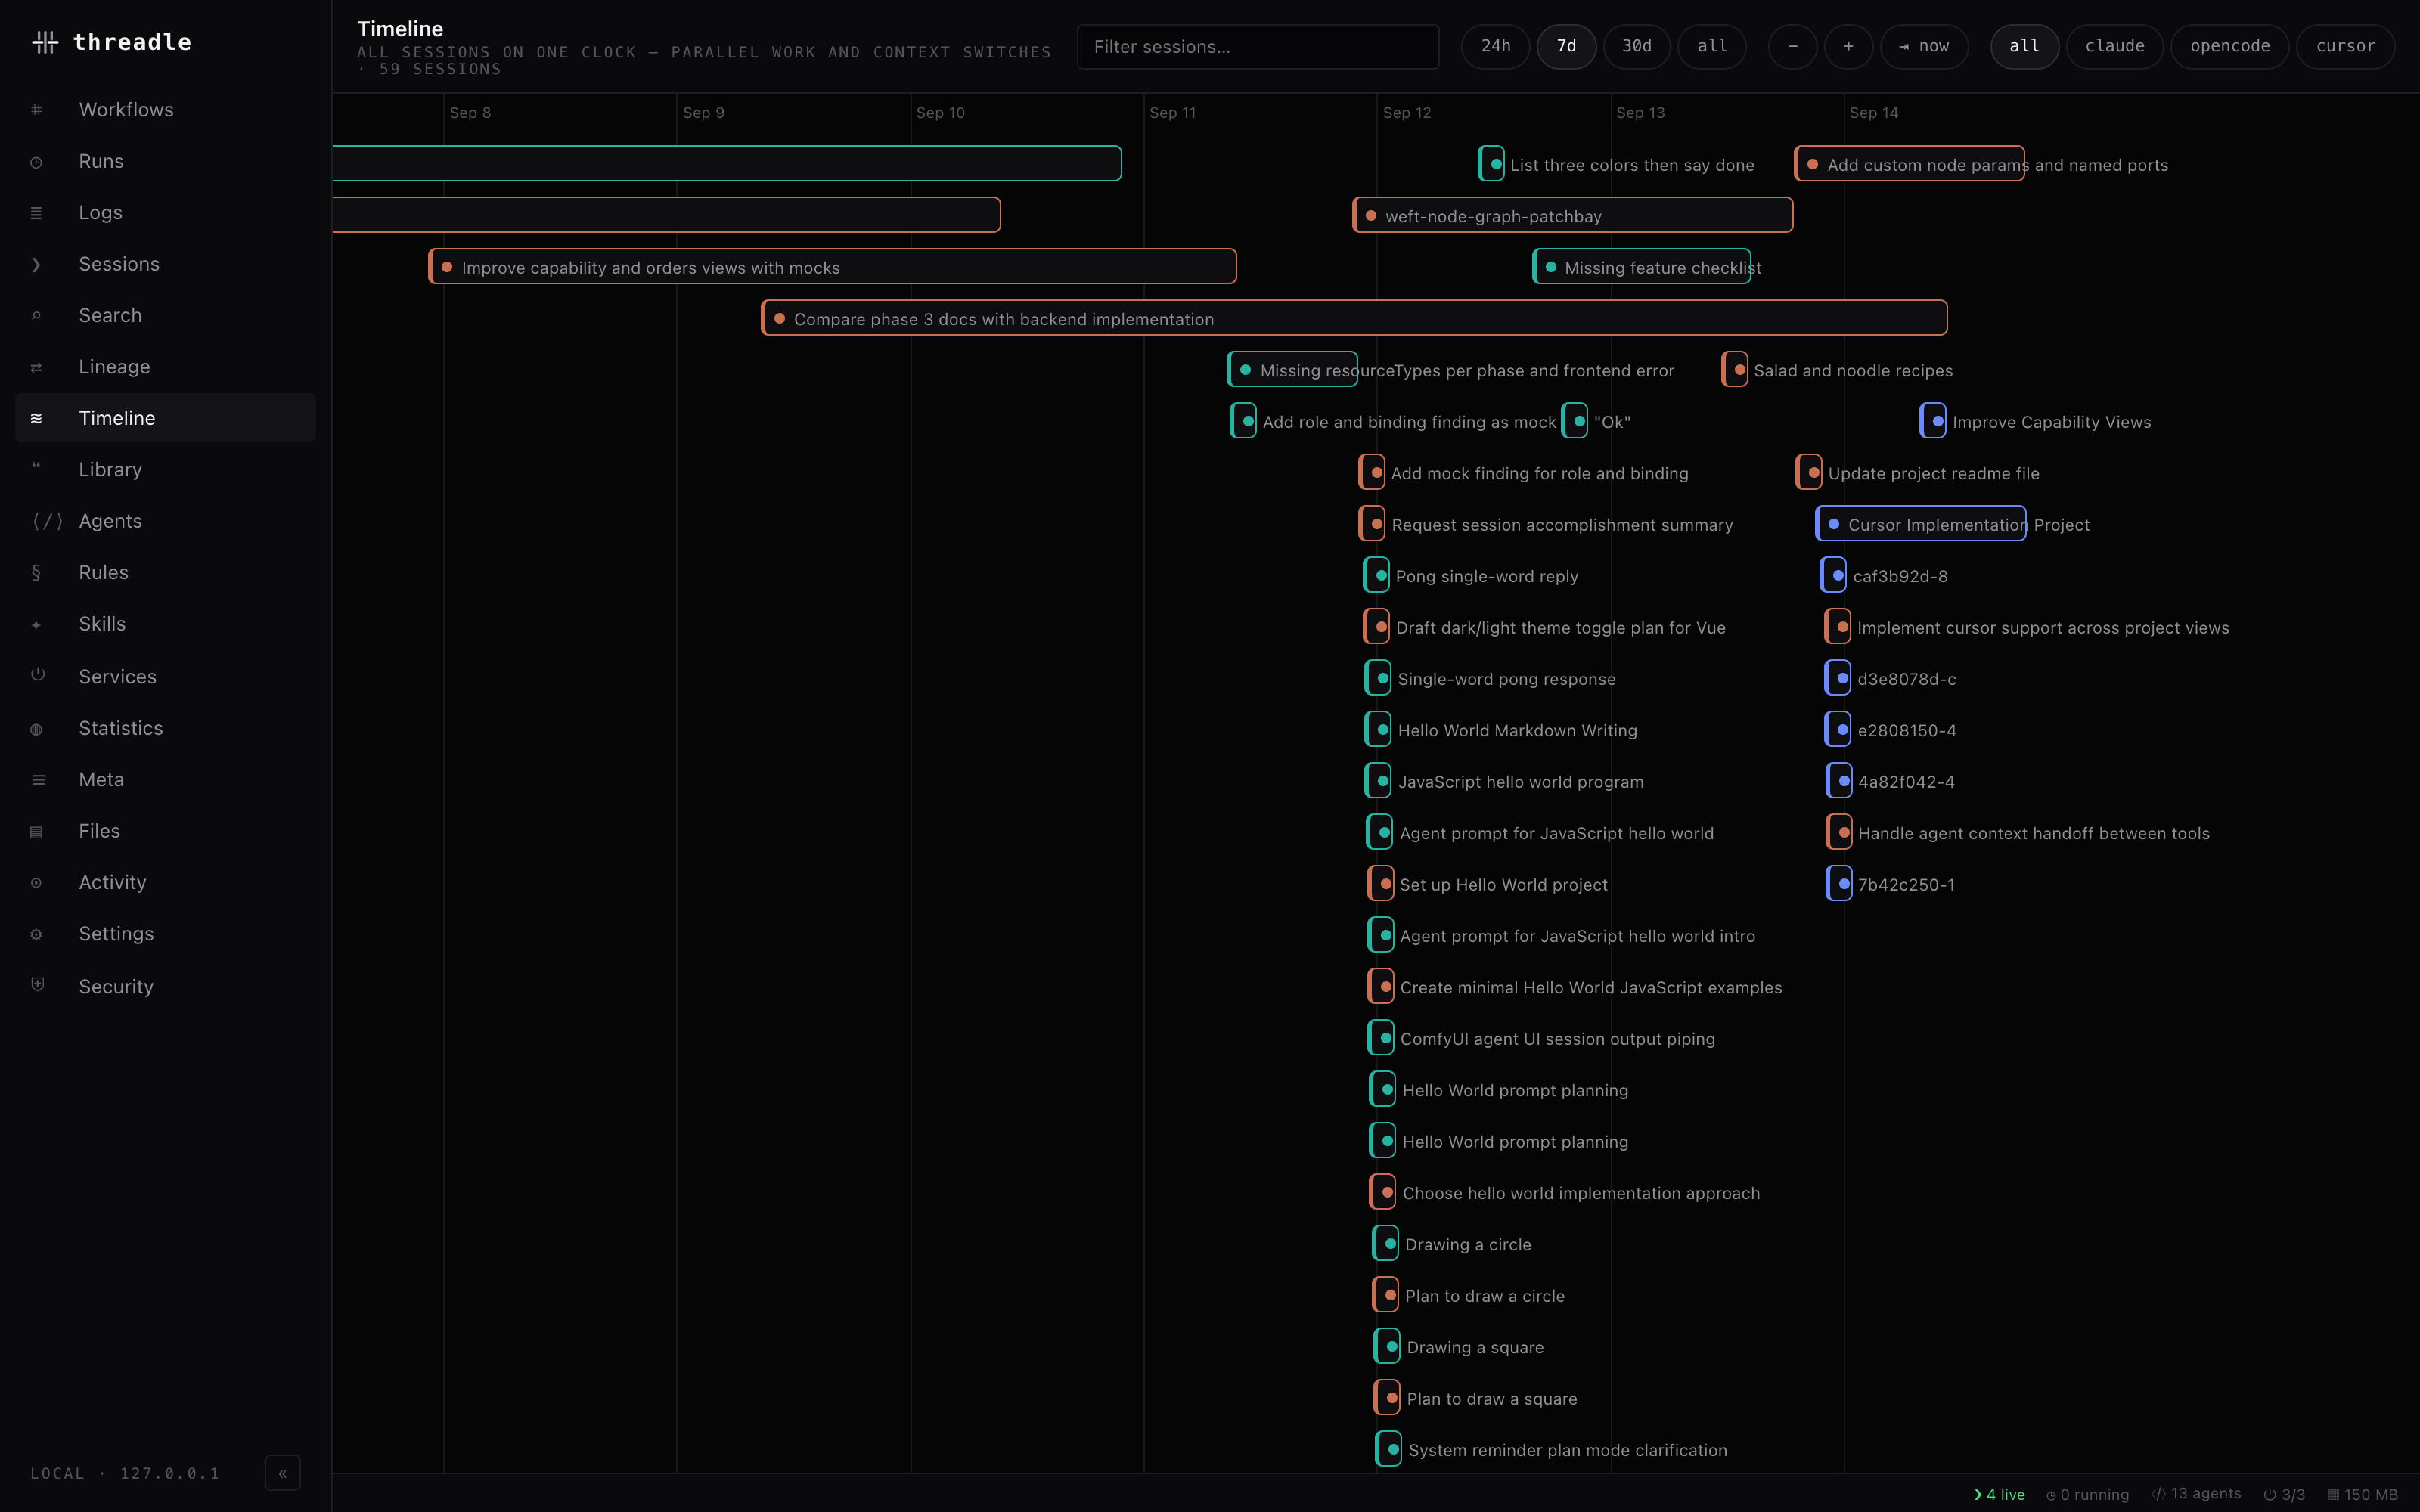
Each bar is a session, packed into rows and coloured by provider — overlaps are parallel work.
Sessions become bars, greedy-packed into rows, coloured and dotted by provider. Subagent runs are excluded; a bar spans createdAt → updatedAt with a 5-minute minimum so quick sessions still render. Live sessions are marked.
| Control | Behaviour |
|---|---|
| Range chips | 24h · 7d (default) · 30d · all — sets the zoom window, not what is on the canvas |
| − / + | Zoom out / in by 1.5× |
| ⇥ now | Reset zoom and jump to the newest edge |
| Provider chips | all · claude · opencode · cursor |
| Filter box | Title, agent, or session id |
The whole history always lives on the canvas — the range only scales it. ctrl/cmd + wheel zooms around the pointer, shift + wheel pans, and dragging empty canvas pans in both axes. A click that never moved clears the selection.
Clicking a bar opens the detail aside: ⌗ blueprint, ⇄ lineage (focused on that session), ❯ sessions view, and the full session info panel.
Session diff
Section titled “Session diff”/diff?a=<provider>::<id>&b=<provider>::<id> — reached from Sessions → select a session → ⇆ compare, then click the second session. Lineage also offers ⇆ diff between a payload’s source and its injected result.
Both sides are loaded from the blueprint endpoint plus the full transcript.
Metrics
Section titled “Metrics”Rows: messages, user turns, tokens in / out / reasoning, cache read, cache write, peak context, last context, compactions, tool errors, duration, tracked costs, actual spend — plus a token source row when a provider reports one. Where the sides differ, the larger value is highlighted as the outlier. Estimated token figures keep their ~ prefix.
The union of both sessions’ tools, with per-side call counts. A tool only one side used shows — on the other, and any differing row is marked.
Files touched
Section titled “Files touched”The union of both file sets as chips: ◍ for files both sessions touched, A or B for files only one did.
Divergence
Section titled “Divergence”User prompts are compared turn by turn. The first differing turn is shown side by side. When every prompt matches, the view says so explicitly — the difference came from the model or tool side, not from you.
Statistics
Section titled “Statistics”The Statistics dashboard view. All figures come from local sessions on this machine.
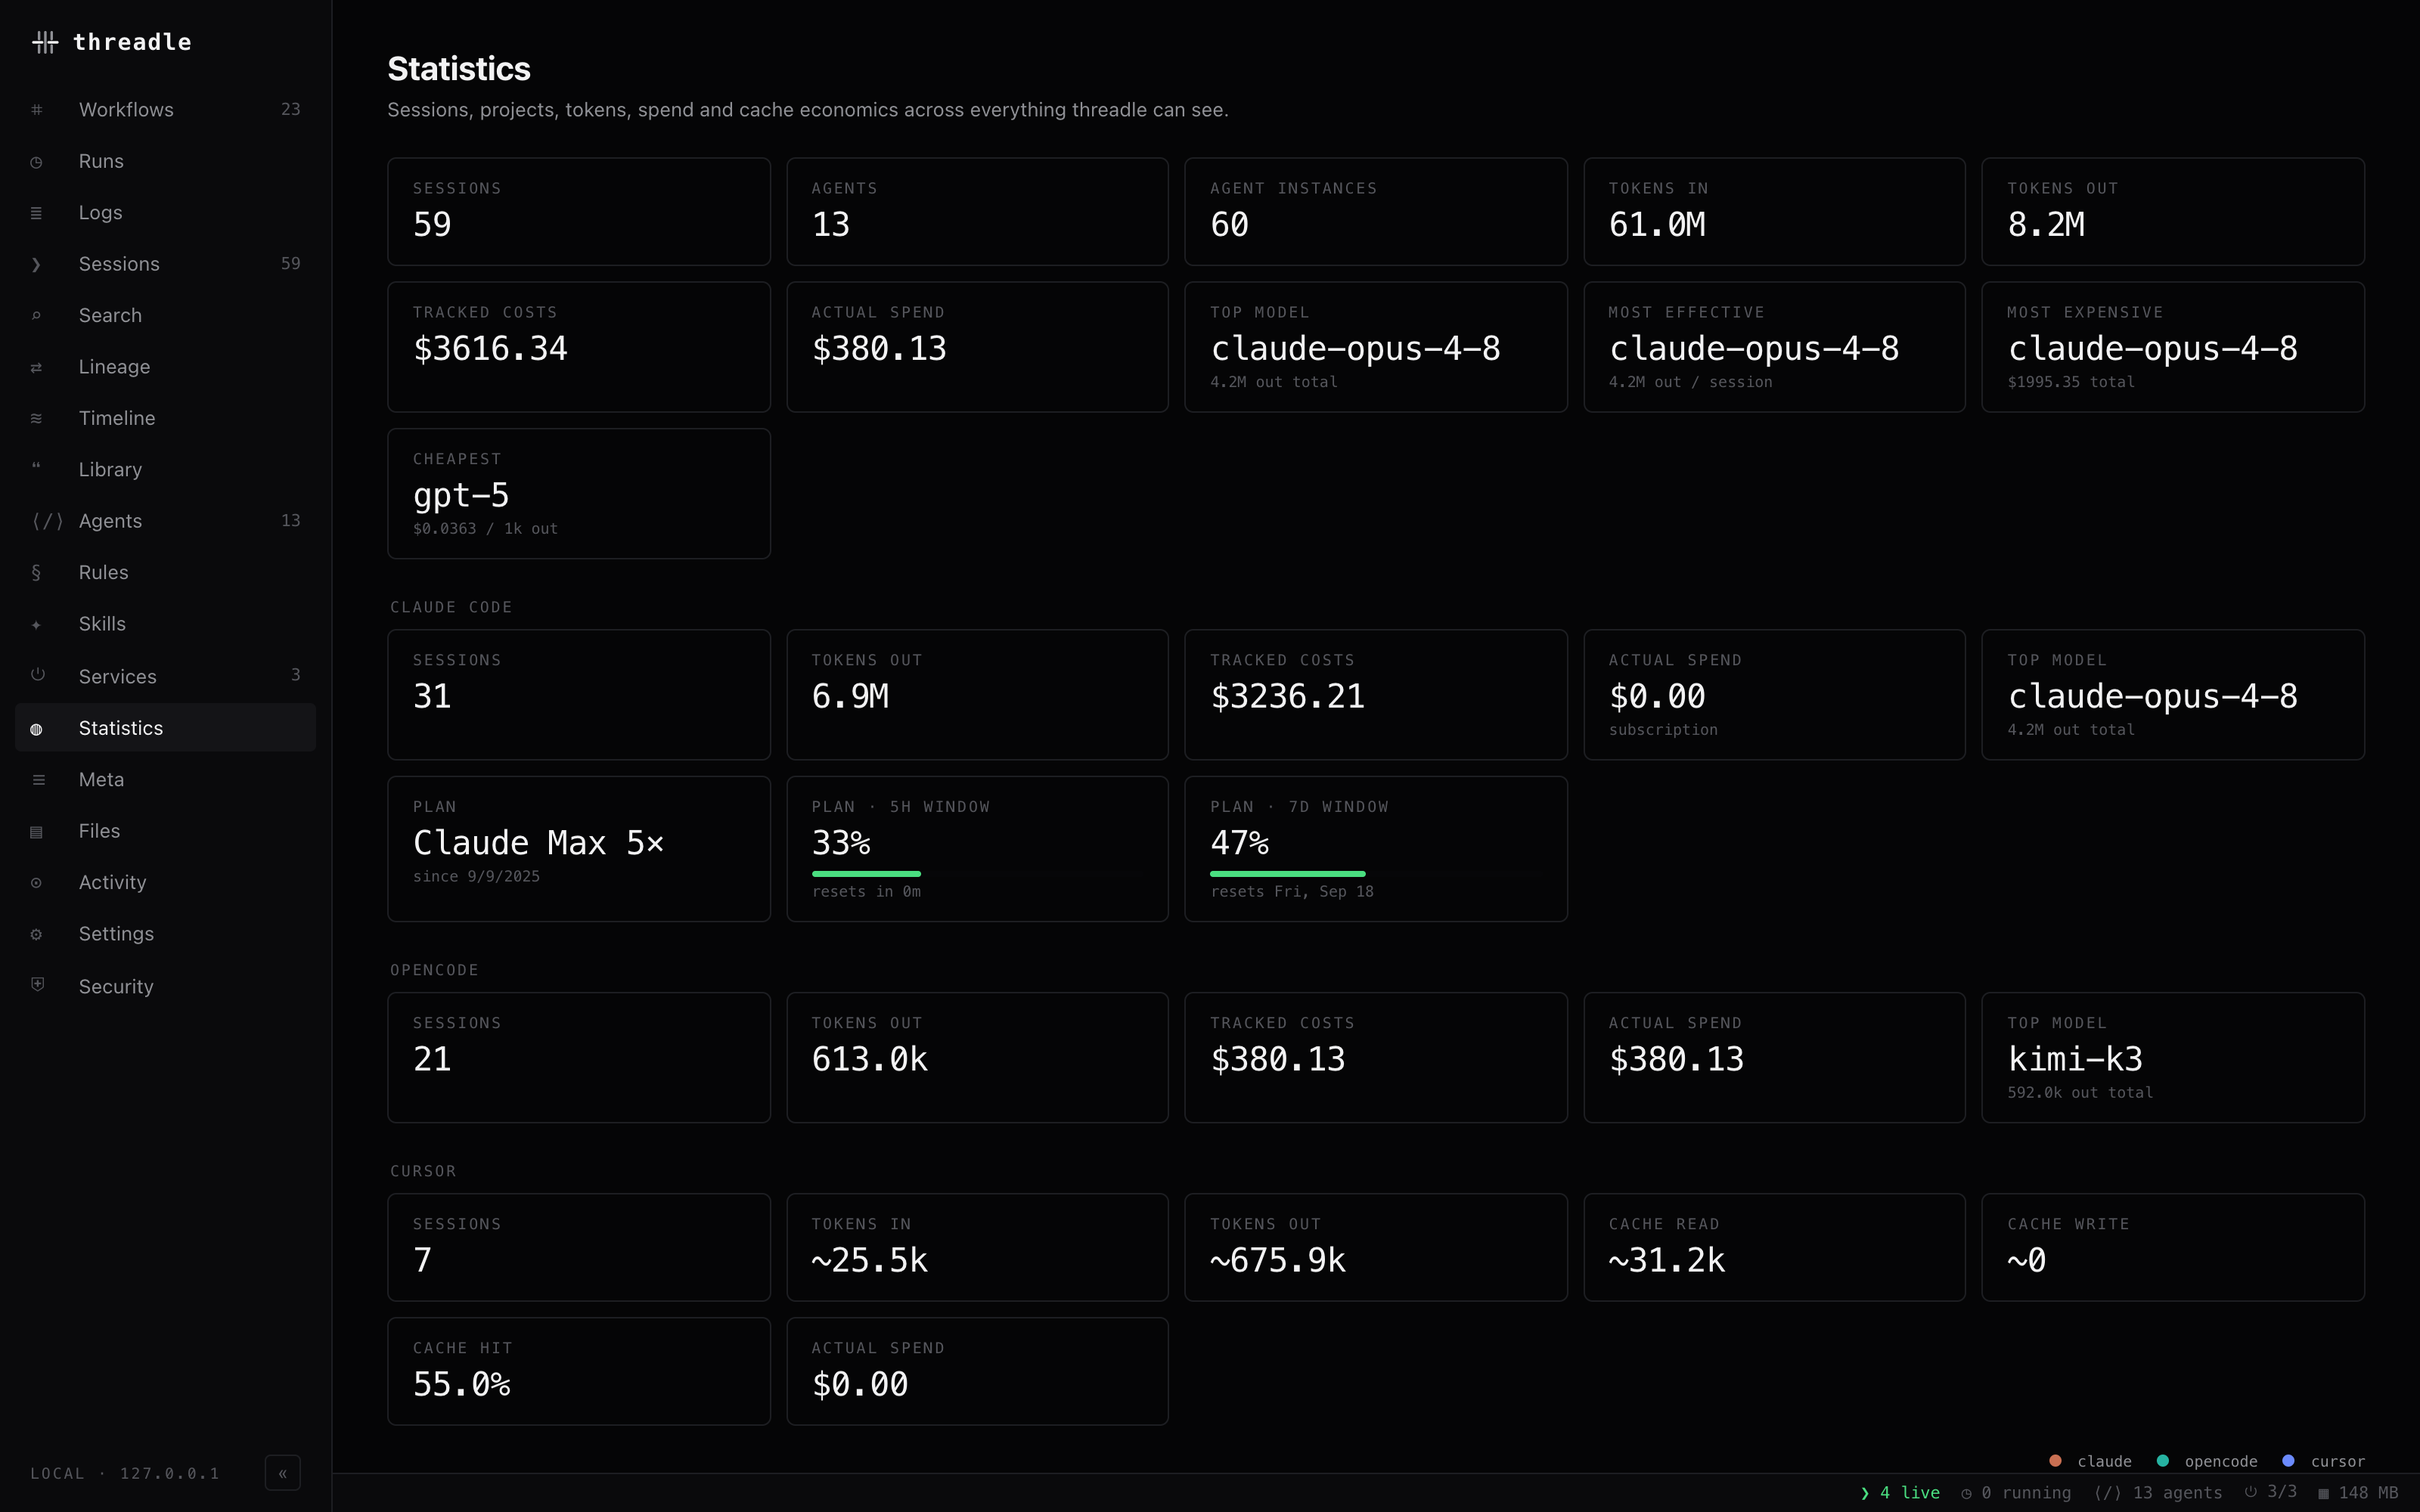
Overall tiles first, then one block per provider — sessions, tokens, tracked costs, actual spend, plan windows.
| Group | Tiles |
|---|---|
| General | sessions · agents · agent instances (with live count) · tokens in · tokens out · tracked costs · actual spend · top model · most effective · most expensive · cheapest |
| claude code | sessions · tokens out · tracked costs · actual spend · top model · plan · plan 5h window · plan 7d window |
| opencode | sessions · tokens out · tracked costs · actual spend · top model |
| cursor | sessions · tokens in · tokens out · reasoning · cache read · cache write · cache hit · actual spend · top model |
Most effective is the highest average output tokens per session; most expensive is the highest total tracked cost; cheapest is the lowest cost per 1k output tokens, and only appears when at least two priced models qualify.
Provider sections only render when that provider has sessions. The plan tiles only appear when Claude Code has cached plan data locally — see Costs & billing.
Charts
Section titled “Charts”Four compact charts, all coloured by provider: sessions started per day over the last 14 days (stacked), output tokens by project (stacked), tracked costs by model, and cache hit rate by provider.
Tables
Section titled “Tables”by model, by provider, and by project share the same columns — sessions, in, out, reason, cache, tracked, actual — and every header sorts. top sessions by output tokens lists the top 15 with agent, tokens, cache rate, and both dollar figures.
Cache rate is always cache read ÷ (fresh in + cache read + cache write).
Model pricing
Section titled “Model pricing”List prices per 1M tokens, grouped by gateway, with in/out, cache read/write, context, max output, reasoning support, and release date. Models you actually used are badged used; the used models only chip filters to them, and ⟳ fetch prices refreshes the local cache on demand. The source is shown next to the controls.
Related
Section titled “Related”- Costs & billing — what tracked and actual spend mean
- Session blueprint — the per-session equivalent
- Sessions — where compare starts
- Lineage — context flow across tools